Social Sciences News

INFOGRAPHICS - A group out of the UO’s InfoGraphics Lab collaborated with Wyoming researchers, including biologist Matt Kauffman and filmmaker Gregory Nickerson, to produce a video that uses 3D visualization to show the doe’s accomplishment and track her most recent migration in the spring of 2019.
GEOGRAPHY, INFOGRAPHICS - Students are being trained in spatial data science are landing exciting jobs and serving humanitarian ends. The spatial data major draws from geography, computer science, and math to consider how location-based data and technologies can be leveraged across public policy, consumer technology, and disaster relief—to name a few of the discipline’s countless applications.
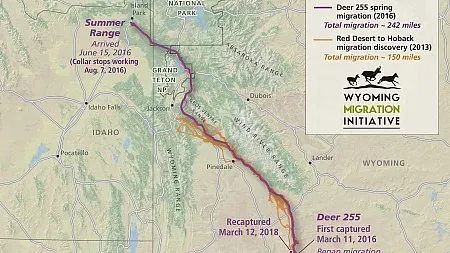
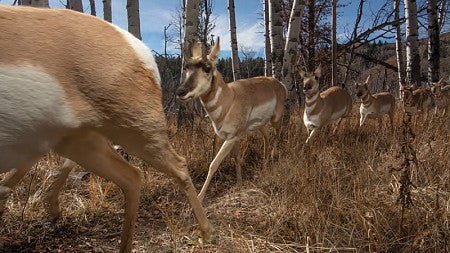
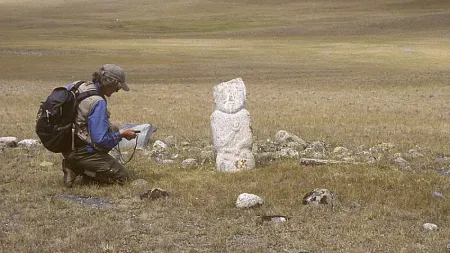
GEOGRAPHY, INFOGRAPHICS - Wild Migrations: Atlas of Wyoming’s Ungulates, published in 2018 by Oregon State University Press, documents deer journeys with words, photographs, and detailed maps.The project was led by tMatthew Kauffman, BS ’92 (biology), and Jim Meacham, BS ’84, MA ’92 (geography).
INFOGRAPHICS - A six-year collaboration between cartographers from the University of Oregon and wildlife biologists from the University of Wyoming has resulted in the publication this fall of “Wild Migrations: Atlas of Wyoming’s Ungulates.”
INFOGRAPHICS - Of the $21.1 million the NEH grant allocated in 2016, only two projects in Oregon earned an award. Of those two projects only UO’s Time Online received the maximum funding allowed. The project is an interactive history of infographic design, and it’s all about collaboration, according to its director and UO Robert D. Clark Honors College history professor Daniel Rosenberg.
INFOGRAPHICS - A map created by the UO Graphics Lab has featured in The New York Times. Science writer James Gorman visited Wyoming to report on a collaborative effort of universities and agencies to document the migration routes and health of the state's mule deer. The story is in the Feb. 3, 2015, Science Times section.
INFOGRAPHICS - For two decades professor Esther Jacobson-Tepfer braved the challenging conditions in Mongolia’s rugged backcountry to catalog the country's monuments. For her work she was honored with the highest award by the Mongolian government. Her work was supported through a collaboration with UO geographer James Meacham and the UO’s InfoGraphics Lab.
INFOGRAPHICS - A video of migrating mule deer in western Wyoming making the rounds at various science news websites is breathtaking, as well as groundbreaking for a team of scientists that includes a group from the UO's InfoGraphics Lab.
INFOGRAPHICS - In 2014, University of Oregon’s then-first lady, Karol Gottfredson, worked on a project to label the trees around campus so that their stories can be appreciated. Infographics Lab has created a comprehensive “Atlas of Trees” and a brief, self-guided tour of the trees on campus is available through the UO’s mobile app so people can see the trees labeled like museum art pieces while walking through campus.
INFOGRAPHICS - In 2011, a way to cut through the PowerPoint led to Pecha Kucha. The trend caught worldwide favor, including in Eugene, then hosted by local enthusiasts Garron Hale and Dan Schmitt. The story features Ken Kato, MS ’00, assistant director of the UO Department of Geography’s InfoGraphics Lab. “Mapmaking,” Kato offered, “is in effect telling stories in space.”